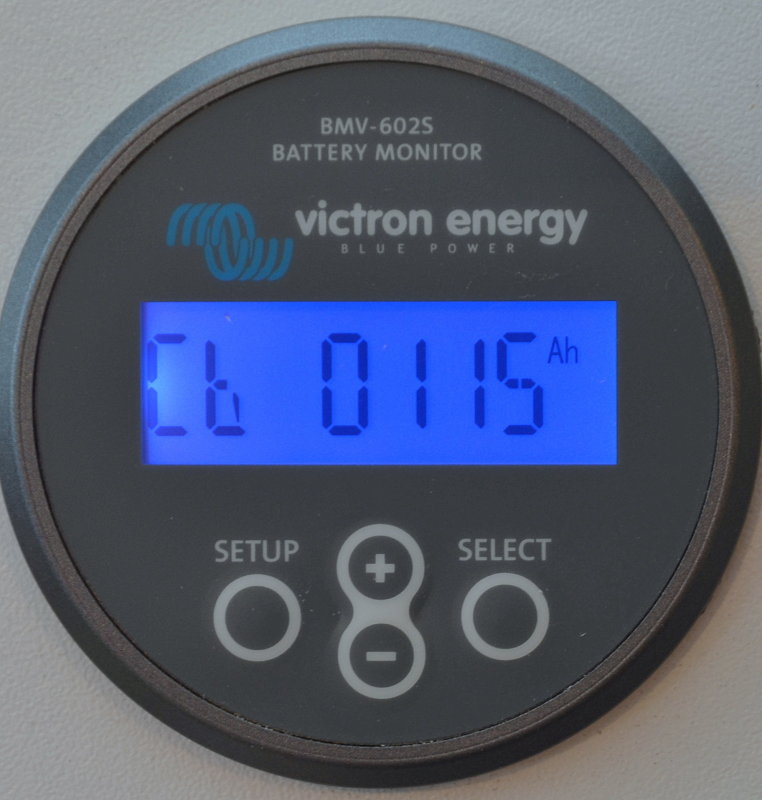
Program The Ah Capacity
This article features the older Victron BMV-602. The 602 has been replaced by the BMV-7oo series (700, 702 & 712). Everything in this article is still relevant to the current series of BMV-7xx battery monitors.
WARNING:
This article is long and in-depth. Please do not misconstrue the points here and think we are trying to talk you out of an Ah counting battery monitor, nothing is further from the truth. Coulomb counting battery monitors give you great information but we also strongly believe owners should better understand;
#1 How they work
#2 How to make them work more accurately
First, let’s preface this article by saying that; I am personally big fan of Ah counting battery monitors. They can give an owner tremendous amounts of excellent and useful data at a glance or with a tap of a button. They can teach you about charging performance, on-board energy usage and even show you historical data. The newer models, such as the Victron BMV-712 or the new Victron SmartShunt even have built in Bluetooth.
Purchasing recommended products from our affiliate partners.Helps keep content coming!
Buy MHT Recommended Battery Monitors- Current Connected
Buy MHT Recommended Battery Monitors – Bay Marine
Where Ah counters frustrate myself, our employees and the average boat owner, is in the ability to accurately track SoC (State of Charge) for the way a cruiser typically uses their vessel.
This article is primarily written for Lead Acid Batteries
LiFePO4 is easier to track:
EVERYTHING BELOW THIS POINT DEALS WITH STATE OF CHARGE (SoC) TRACKING PERFORMANCE
When I first wrote the article on installing and wiring of a battery monitor, (See; Installing a Battery Monitor) I had originally intended to write this sister article to it, but never got to it. Unfortunately this is the article that should have been written first as it’s actually the far more important part of installing and using a battery monitor.
The SoC (state of charge) tracking problems with Ah counters are well known among us electrical geeks, throughout industry, military etc.. Unfortunately no one ever really discusses it frankly or in an in-depth manner. While Ah counters are extremely accurate at counting ampere hours (Ah) it is what the Ah counter is counting these ampere hours against, an ever moving target called a battery, that creates the problems. This article is going to show you why PROPER PROGRAMING PAYS.
To sum it up in simple terms we have yet to come more than a handful of properly installed and properly calibrated Ah counters. Most of the time the failure of the install is in the programming, typically a lack thereof. However, the shunt wiring is confusing for some boat owners who conduct a DIY install as well as some professionals. I know this sounds shockingly surprising, but when you fully understand and comprehend how Coulomb counting works, and how a battery ages, it becomes a lot clearer as to why such craziness can be stated.
As a marine electrical business we are physically set up to test batteries for their true Ah capacity. Unfortunately in this industry I can count on one hand the number of marine electrical contractors or business that are set up to do this. To track this performance we simply note the SOC screen, and energy consumed screen on the battery monitor, when the batteries are removed from the vessel for testing.
This is simple; We have not yet seen an Ah counter’s SoC be within 10% of actual tested capacity and most are far worse than a 10% error. Is this the fault of the Ah counter? No, it’s not. It’s the fault of improper use, lack of understanding and poor programming.
FACT: If you do not keep up with programming your Ah counter, on a routine basis, Ah counters do not theoretically get out of sync with your battery, they physically get out of sync with your battery. This is a real problem that does happen, not a made up problem that might happen.
FACT: Ah or Coulomb Counters are very accurate at counting Ah’s but they do not track changes in your batteries health. They are simply calculators that rely on proper programming to yield a more accurate output.
This article is not going to explain the actual button pushes to adjust your particular monitor, there are far too many products out there to do this with, but we are going to discuss the importance of each piece of the programming puzzle, and why that part is critical to the performance of your Ah counter. Not all monitors offer all the programming features that may be discussed here. For example, the earlier Victron BMV-600 & BMV-602 offered no temperature adjustments or temp sensor options, newer models do. Some Ah counters, early Victron’s and Xantrex battery monitors, offered an automatic calculation for charge efficiency and for others you’ll need to manually program the charge efficiency into the unit.
Bare Minimum Programming Steps:
-Program an Accurate Ah Capacity of Your Bank (best to obtain through testing)
-Program Your Banks Peukert’s Constant (obtain from battery manufacturer or calculate)
-Program Your Banks Charge Efficiency (obtain from battery manufacturer)
-Program Your Battery Temp (Should be done at least monthly if temps change, or use model with temp sensor)
The Battery; an Ever Moving Target
This section deals with the battery and how it changes with age, temp or other external factors as related to how an Ah or Coulomb counter attempts to track battery SoC.
#1 Battery Capacity:
The amp hour capacity of all deep cycle lead acid batteries is an ever moving target and the only way to track this moving target is for you to properly program it. The typical Coulomb counting battery monitor cannot, and does not, track changes in capacity, changes in charge efficiency (though some can) or changes to Peukert. It is the job of the owner to track these changes and update the programming of the monitor so that it has a more accurate data-set to calculate from.
Unfortunately deep cycle batteries never stay in one spot for very long and from day one they begin changing. How fast the capacity degrades is partially up to the banks owner and partially due to cycles, temperature and a host of other factors that all converge to eat away at your batteries actual Ah capacity compared to its rated Ah capacity. Different battery technologies will also yield differing slide-rates into the abyss. Certain battery technologies will also cycle-up to capacity faster than others? Cycle-up to capacity? Yes, cycle-up.
Incorrect assumption #1:
“My batteries are 100Ah, because the sticker says so.”
Rule #1 for Ah counter accuracy; never assume your capacity. Typical flooded lead acid batteries won’t deliver the full 20 hour capacity right out of the box, as many often assume they do. Batteries, especially deep cycle thick-plate flooded batteries, take as many as 50+ deep-cycles to attain their rated capacity. The problem is that many boat owners have already worn them out or ruined them before they’ve actually had a chance to cycle-up to full rated capacity. In other words many owners never even attain the full rating of the battery due to abuses.
Programming in the full rated sticker-capacity of the battery, without first knowing if that rating is accurate or true, may not be accurate. The sticker is good guidance, you as the owner would be best served to ascertain if that guidance is in fact correct, especially if you want any level of accuracy from your Ah counter.
AGM and GEL batteries cycle-up to rated capacity in considerably less cycles due to the way the battery plates are formed. Most commercially available AGM’s will cycle to full rated capacity in 3-7 deep cycles & GEL’s often within 30 cycles..
The problem is that not all batteries you purchase will always deliver the rated capacity. Often they are within 1-3% of the rating, some exceed it slightly, but we have tested many brand new VRLA batteries, or just broken in batteries, that are 4-15% off their claimed Ah capacity figures, right off the shelf. While 1-3% is acceptable 4-15% off rated capacity is not and can lead to Ah counting and SoC prediction problems.
Deep cycle flooded batteries are even more of a mystery, as related to Ah capacity. Identifying Ah capacity on flooded batteries is more difficult because of the way they slowly cycle-up, level out, and then begin trending down. What’s an owner to do, if you don’t physically capacity test your batteries? How will you know the actual capacity figure to put into the battery monitor? The simple answer is that, you don’t. Is this bad? Not necessarily with new batteries, but as they age it is.
The Typical Ah Counter is Just a Simple Calculator
The Ah counter is a factual item, like a calculator, and it is important to remember this. In fact, it is a calculator, and that is really all it is. The Ah counter relies on your input being accurate, so it can display a useful calculation. If you wanted to know 9X9=XX on a calculator you would type in 9X9 hit = and you’d get the answer of 81. A battery monitor is no different, it is nothing more than a calculator.
If you plug in 200Ah’s, for Ah capacity, it believes what you told it to be correct, even if your batteries are only 160Ah’s in their current state of health. Just like a calculator the Ah counter will give you accurate information based on what you have plugged into it. If you accidentally keyed in 6X9 and got 54 would that be the correct answer for 9X9?
Programming in erroneous data results in incorrect answers…
Programming in a correct Ah capacity is really just the tip of the ice-burg, but perhaps the most important part…
SITE PLUG: Please support MarineHowTo.com by purchasing your Victron battery monitor through our affiliate partners. Below we’ve included a link to our Amazon storefront for those who like to buy from Amazon
Bouy Victron Products – Amazon
Cycling Up To Rated Capacity
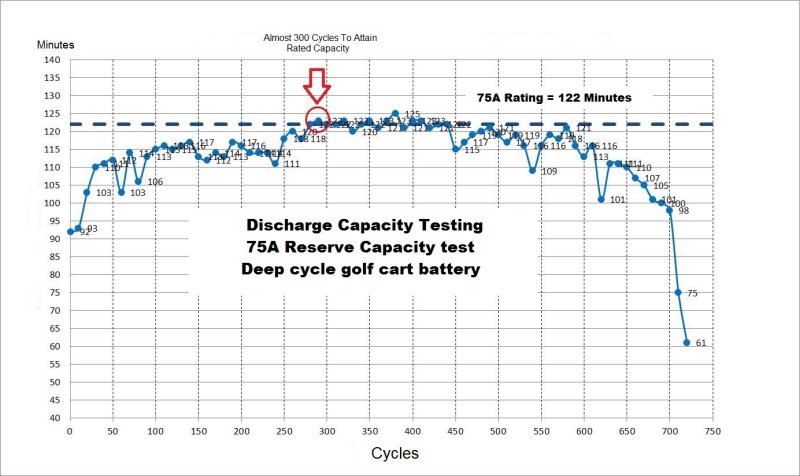
This is a graph of cycle life to delivered capacity for a flooded deep cycle lead acid battery we use in boats quite often. Take a look at how capacity changes with life and cycles. Also remember that in the lab they get 700+ cycles but in the real world most boat batteries are destroyed in well under 200 cycles.
What is Ampere Hour Capacity?
The Ah capacity of deep cycle marine batteries is based on the BCI (Battery Council International) 20 hour discharge test. For a 100Ah battery this means it should deliver a 5A constant load, at 77F, for 20 hours, before the loaded terminal voltage falls to 10.5V. This is your ideal factory rated Ah capacity, but you’ll notice two things.
The first thing that stands out is the 5A constant-current. In order to meet the 20 hour capacity test figure, the current is held perfectly stable, even as the voltage decays/falls during the test.
Effect of Load on Usable Capacity
As a battery discharges, the load it is discharged at will change the usable capacity of the bank, at that load. The only way you can get 20 hours of run time, at 77F, is at the 20 hour discharge rate. Any load greater than the 20 hour load, the battery will not deliver its full rated capacity. On the flip side, if we draw the battery at less than the 20 hour rate we can extract slightly more usable Ah capacity out of it.
I prefer to call this the Peukert effect. I hesitate to call it Peukert’s law because it is not a law, like Ohm’s Law is. Peukert is an effect that changes the usable capacity based on rate of discharge.
In order to test the battery at the 20 hour rate, and do so accurately, you ideally need to hold the discharge current steady as the voltage decays to the 10.5V cut off point. This is a tedious and imprecise process for the average DIY. There is test equipment available to conduct accurate 20 hour Ah capacity tests but they typically begin in the four figure price range. A 20 hour test is just as it implies, 20 hours long, not including the time it took you to charge the battery and get it to a controlled temp of 75-80F.
“How do I determine my batteries 20 hour discharge rate?”
This part is easy, you divide your batteries 20 hour Ah capacity by 20, eg: 100Ah ÷ 20 = 5A. If you had a 210Ah battery the math is the same; 210 ÷ 20 = 10.5A. If you want to test for Ah capacity, which is really the only test that matters for an Ah counter, then this is the formula for determining the constant-current discharge load you will use.
Effect of Temperature on Capacity
The second thing you will notice in a 20 hour rating is the 77F – 80F temperature. Just like the rate of discharge, battery temperature affects your usable Ah capacity. If you do not maintain a battery temp of 75-80F, during testing, you will not arrive at or get a very accurate 20 hour capacity. When conducting a capacity test, in order to properly program a battery monitor, discharge current and battery temp ideally need to remain constant & stable while the battery is discharged to 10.5V. You can always hip-shoot, make sure the battery is between 70F and 80F, and manually control the load to maintain as close to stable as possible, and you’ll wind up pretty close.
Inaccurate Ah Capacity = Bad Data
If you don’t start with a known accurate Ah capacity, your Ah counter cannot give you reliable or accurate information. At a bare minimum, for cooler climates, a once yearly 20 hour capacity test to 10.5V should ideally be conducted. In warmer climates, defined as average battery temps above 80F, bi-yearly is going to be a better choice.
“How can I conduct an accurate 20 hour capacity test?”
20 Hour Capacity Test:
#1 Fully charge battery, equalize if possible, then allow it to rest disconnected for 24 hours
#2 Make certain battery temperature is between 75F & 80F
#3 Apply a DC load that = Ah Capacity ÷ 20 (small light bulbs and/or resistors can work)
#4 Connect an accurate digital volt meter to the positive and negative battery terminals
#5 Start the DC load and a stop watch at the same time
#6 As battery voltage drops, during discharge, adjust the DC load to maintain as close to the C÷20 rate as is humanly possible
#7 Immediately stop the discharge test when battery terminal voltage hits 10.499V
#8 Note the hours and minutes of run time on the stop watch and figure your percentage of 20 hours that it ran. This is your batteries Ah capacity or state of health as a percentage. For example if a 100Ah battery ran for 16 hours it is at 80% of its original rated capacity. Flooded lead acid batteries are considered, by industry standards, “end of life” when they can no longer deliver 80% or more of their rated Ah capcity.
#9 Recharge the battery immediately at the 20 hour rate. Follow this up with equalization level voltage and measure specific gravity until all cells match. (EQ – not for non-Lifeline AGM or GEL). A long slow recharge can have a slight reforming effect on flooded batteries and can actually recover some lost capacity. It is not uncommon for a battery to have more capacity after a 20 hour test than it had going into it.
“But isn’t 10.5V bad for my batteries?”
A yearly discharge test, done correctly, is arguably less damaging than taking your battery to 50% SOC and leaving it in that range for a day or two, or the continual PSOC cycling the average boater thinks nothing of when cruising. Regular PSOC cycling is more damaging than a once or twice yearly Ah capacity test done correctly. A proper capacity test simply counts as another deep cycle and can actually revive some lost capacity.
“Can I conduct an approximate 20 hour capacity test?”
Approximate Capacity Test:
#1 Fully charge battery, equalize if possible, then allow it to rest disconnected for 24 hours
#2 Make certain battery temperature is between 75F & 80F
#3 Apply a DC load for 2 hours that = Ah Capacity ÷ 20 (small light bulbs and/or resistors can work)
#4 Allow the battery to rest for at least 10 hours at 75-80F (24+ hours is significantly more accurate)
#5 *Check the specific gravity or resting open circuit voltage and compare to the manufacturers SG or SOC to OCV tables
#6 Use basic math to determine the approximate Ah capacity. For example, a 100Ah rated battery has been discharged at 5A for 2 hours. This means so you removed 10Ah’s of capacity. If the battery was in perfect health specific gravity readings or open circuit voltage readings should show the battery at 90% SOC. *If SG and OCV only show the battery at 60% SOC then the battery has lost approximately 30% of it’s Ah capacity.
*This is an approximation only and not an accurate Ah capacity test. Variances can be anywhere from 10-18% off an actual 20 hour capacity test depending upon your particular battery.
CAUTION: The only time your batteries should regularly be taken below *12.1V is during a capacity test. For regular house use, at your average house loads, your deepest loaded voltage should ideally not dip below 12.1V or better yet 12.2V. Unless you are running short duration high load device such as an inverter, windlass, electric winches, bow-thruster, water maker etc. don’t let your bank voltage dip below 12.1V.
For certain situations, such as an off-shore passage or open ocean racing, discharging to 70-80% DOD is perfectly acceptable provided the batteries receive a proper 100% SOC re-charge as soon as you get to the destination. Discharging below 50% SOC on a regular basis, in a PSOC environment, drastically shortens battery life when compared to 50%.
*Firefly AGM, large format 2V or 6V batteries, & some GEL batteries would be an exception for regularly discharging below 50% SOC.
Typical Programmed Capacity
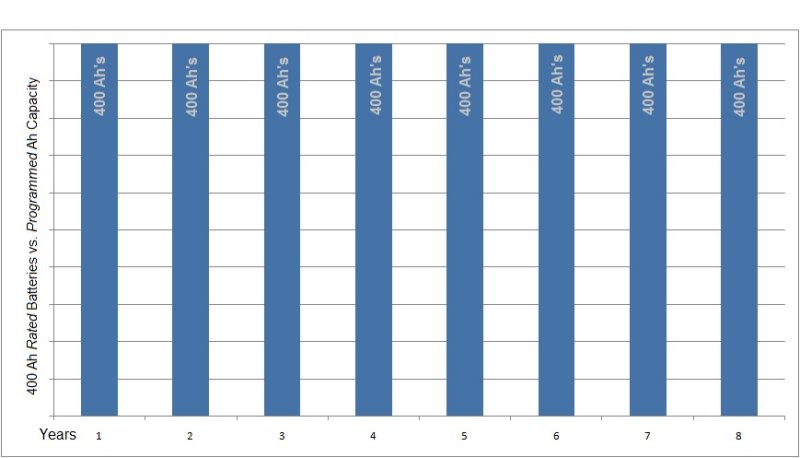
Sadly this is typically how see a good portion of battery monitors set up, by using the stickered rating of the batteries. The typical battery monitor is initially programmed for say 400 Ah’s, as shown, and left there indefinitely.This = BAD
Do you think that at year two, three, four, five, six etc. this bank still has 400Ah’s of capacity..?
What is Your Ah Capacity?
How can an Ah counter be accurate if your programmed Ah capacity is not accurate? The answer is simple, IT CAN’T BE.
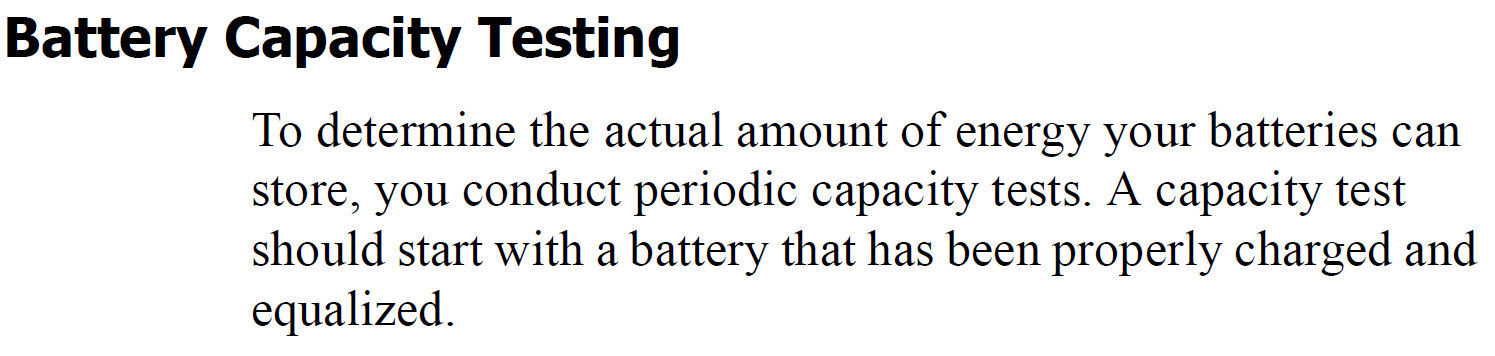
Years ago Ah counter manufacturers were a bit more honest and forthcoming in their manuals about Ah capacity & testing for it. This image is from an old Link 1000 manual I had on my hard drive. As can be seen it is saying:
“To determine the actual amount of energy your batteries can store, you conduct periodic capacity tests. A capacity test should start with a battery that has been properly charged and equalized.”
Today this information has been summarily removed from nearly every Ah counter manual I have read. Frustrating? Yes.. Dishonest & misleading to leave this out? Absolutely!
They Even Explained How to Capacity Test Your Batteries
Again, this was in a nearly 18 year old Link 1000 manual. I don’t know of any current Ah counter manuals that include this information today
.

More Realistic Programmed Capacity
If you are testing your batteries yearly or bi-yearly the programmed capacity will look more like this…
WARNING: Do not duplicate the decline in this graph, it is for illustrative purposes only!

“So RC how can I program a decline without doing a capacity test?”
How do you predict the stock market?? The honest answer is, I don’t know. I don’t know because I don’t know how you treat, use or charge your batteries.
I have seen some boat owners ruin 6V golf cart batteries in 1 year while others get 12 years. Sadly I can’t predict that..
Honestly if I could predict the rate of decline for marine batteries on everyone’s boats I would not be sitting here typing this right now. I’d be putting buy orders on the stocks that would rise on Monday.
Having said that, programming in even a hip-shoot decline each year will result in longer battery life than no programmed decline at all. Will it be accurate? Not at all, but your batteries will be cycled less deeply as they age and as a result should last longer than no programmed decline at all.
Bottom line is that you really need to have some decline programed in to even remain in the ball-park, but no one can predict that.
What if my Ah counters capacity does not match my batteries?
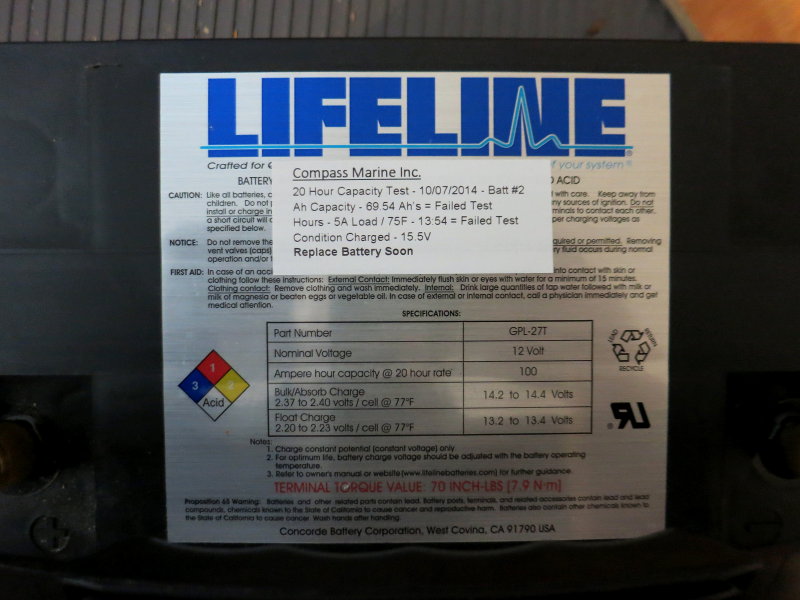
Let’s look at the case of this pair of “100 Ah” batteries. These batteries were barely three years old when I tested them for Ah capacity. They had a tested capacity of just 69 & 70 Ah’s respectively, as tested at 77F, under a 5A constant load. The owner of this bank still had the battery monitor programmed for 200Ah’s, as many boaters often do at year three.
If we add 69 Ah’s + 70 Ah’s we can see that his actual capacity, of this bank, was now just 139 Ah’s not the 200 Ah’s the owner assumed it was. Herein lies problem, the owner was still discharging this bank as if it was still a 200 Ah battery bank. D’oh!
Using -Ah’s To Track SOC = INACCURATE

This is a shot of one of my capacity tester screens after testing the battery pictured above.
To compound the issues with these batteries the owner was using the -Ah’s or consumed energy screen in order to discharge the bank to his assumed 50% SOC. Unfortunately this is not the correct screen for tracking SOC.
Why?
The –Ah’s screen on almost all Ah counters I know of does not compensate for Coulombic efficiency, temperature or Peukert. Only the % charged or the SOC screens actually compensate for the factors listed. As you know by now these factors affect & adjust your actual SOC up or down from the actual -Ah’s removed.
By using –Ah’s or consumed energy type screens only, you wind up with a misrepresentation of your actual SOC. Discharging 50% of the assumed capacity from a 200Ah bank, in theory, leaves you with 100Ah’s. This owner only really has a 139 Ah bank, so remove 100Ah’s from that bank, not even accounting for temp, Peukert etc., and we are really taking the bank to approx 28% SOC with each owner assumed dip to 50% SOC. What if he used the -Ah’s screen to discharge 50% of the assumed 200 Ah capacity and his batteries were just 45F and 139 Ah’s?
These factors affect & adjust your actual SOC in relation to the actual -Ah’s removed. This boat owner was at approximately 28% SOC with each assumed cycle to 50% SOC, if we just assume face value for -Ah’s, as this owner did.
With these images of actual tested Ah capacity it becomes very easy to see how these batteries literally fell off the proverbial cliff in just three years. Was the battery monitor the sole cause of the demise of these batteries? No, absolutely not, but it got to a point where it was hurting more than helping.
Unfortunately, the Ah capacity faded due to abuses, and the owner continued discharging them as if they were new. The battery monitors incorrect programming and misuse began to contribute in a larger way to the demise of this bank and was actually hurting not helping.
If you want any sort of SOC based accuracy from an Ah counter you really should start with your banks actual measured & tested Ah capacity not an assumed capacity based on a sticker.
For a glimpse into how bad the programming situation really is I dug into my shop notes and invoices to show a few examples of ACTUAL vs. PROGRAMMED capacity. Below are a hand full of battery banks I have physically tested from boats with Ah counters installed. I have noted the both the banks actual tested capacity and the programmed capacity. All of these owners thought they knew how to use an Ah counter and many had no idea their batteries were as bad as they were.
Tested Battery Banks: Actual Ah Capacity vs. Programmed Ah Capacity
Deka G31 AGM 105Ah X 3 – #1=68.4Ah, #2=68.7Ah, #3=69.1Ah
ACTUAL = 206.2Ah
PROGRAMMED = 300Ah
Lifeline G27 AGM 100Ah X 4 – #1=71.4Ah, #2=71.0Ah, #3=70.9Ah, #4=71.2Ah
ACTUAL = 284.5Ah
PROGRAMMED = 400Ah
Trojan J185 FDC 205Ah X 4 – #1=154.3Ah, #2=151.2Ah #3=155.1Ah, #4=149.2Ah
ACTUAL = 609.6Ah
PROGRAMMED = 820Ah
Deka 8D GEL 225Ah X 2 – #1=216.1Ah, #2=215.8Ah
ACTUAL = 431.9Ah
PROGRAMMED = 450Ah
Full River G31 AGM 115Ah X 4 – #1=89.3Ah, #2=88.4Ah, #3=89.9Ah, #4=90.1Ah
ACTUAL = 277.7Ah
PROGRAMMED = 440Ah
Deka 4D AGM 198Ah X 3 – #1=63.4Ah, #2=69.6Ah, #3=73.8Ah
ACTUAL = 206.8Ah
PROGRAMMED = 590Ah
Firefly G31 AGM 110Ah X 3 – #1=110.1Ah, #2=109.7Ah, #3=110.4Ah
ACTUAL = 330.2Ah
PROGRAMMED = 330Ah
Odyssey G31 AGM 100Ah X 4 – #1=77.1Ah, #2=78.4Ah, #3=78.9Ah, #4=79.2Ah
ACTUAL = 313.6Ah
PROGRAMMED = 380Ah
*East Penn 6V GC-15 230Ah X 6 – Pair #1=112.3Ah
*ACTUAL = 336.9Ah
PROGRAMMED = 650Ah
**Trojan GC-12 FDC 150Ah X 5 – #1=62.8Ah, #2=66.9Ah, #3=54.6Ah
**ACTUAL = 307.1Ah
PROGRAMMED = 700Ah
*Only tested two of the six as a 12V series pair and data extrapolated for all six based on pair #1.
** Only tested three batteries, no sense going further, data averaged and extrapolated for actual capacity.
The above data makes it easy to see the issues we have with incorrect programming of Ah counters.
Coulombic Efficiency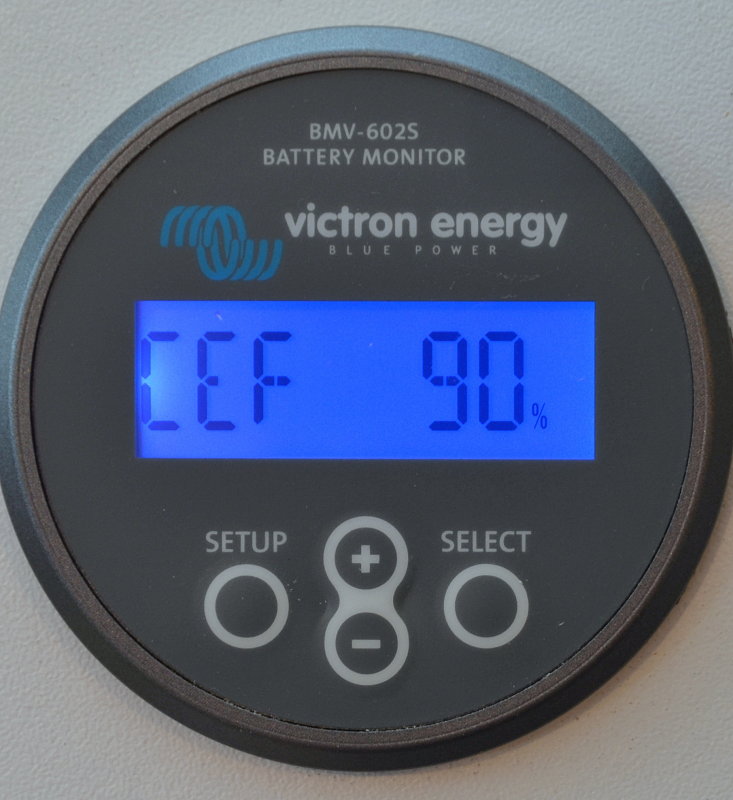
This happens to be the set up screen for a Victron BMV-602 for the Charge Efficiency Factor or CEF. Here it is set for 90% which means it will calculate for 110% of the ampere hours that were removed, being returned.
Coulombic efficiency is the charge efficiency of your battery. In a perfect battery we would take 50 amp hours out and put 50 amp hours back in and this would be a Coulombic efficiency of 100%. With lead acid batteries it does not work like this and just like the Ah capacity changes with age, so does charge efficiency. Coulombic efficiency, like Ah capacity, is also a moving target.
Even the most charge efficient lead acid batteries often require 110% of removed capacity to be returned, and some batteries require 130% or more. As batteries age, and sulfate, charge efficiency can get worse. This means that if you use 100Ah’s you need to put back 110Ah’s to 130Ah’s plus in order to reach full charge.
Another issue with charge efficiency is that it’s different at different stages & different points in the SOC curve. Coulombic efficiency is also impacted by battery temperature as well. In bulk charging, when the battery is taking constant-current, the charge efficiency can be pretty close to 98-99% for lead acid batteries yet the last 5% of the SOC curve can see charge efficiencies at less than 50% efficient.
If you discharged to 50% SOC then replaced 20Ah’s, while never attaining a limiting voltage, you could take almost all of that 20Ah’s back out of the battery and wind up at the same exact SOC. BULK charging is a very efficient stage of charging, but absorption is not.
Sadly most Ah counters have no way to discern a difference between bulk and absorption or the gassing stages of charging where Coulombic efficiency is the worst.
Begin Quote:
“Charge Efficiency Factor: This is the traditional method used by the battery monitor, and the method used by some other similar monitors. This counts the amp-hours discharged exactly, at 100% rate, but when adding amp hours back (charging) they are counted at a lesser value, for example only 94% of actual charge. This requires that to make the “battery % full” display go back up to 100% charged, slightly more charge (6% more in this case) must be put back compared to what was discharged. This is the effect produced by the “efficiency factor” setting which is set at the factory to a recommended value of 94%, however you may program this to any value you wish from 60 to 100%.”
End Quote:
Please let that quote from a battery monitor manual sink in. If you understand anything about charge efficiency you’ll recognize that it’s not the same throughout the SOC curve. By applying a fixed percentage subtracted, as the Ah’s are counted back up results in counting errors if you don’t go all the way back to 100% SOC after each discharge. Simple stuff.
On boats we also use different charge sources, with different charge rates, all of which impact the overall charge efficiency.
- What if you stop charging in bulk, which is darn near 100% efficient, but the monitor has already counted your SOC back up with a 10% handicap?
- What if you only discharge to 94% SOC and the Ah counter subtracts 10% on the re-count but the charge efficiency was closer to 50% at high SOC?
Coulombic efficiency is sort of like Peukert, the rate of re-charge current can also cause changes in charge efficiency. A low charge rate of say 4% of battery capacity, 4A for a 100Ah flooded battery, the battery will have a better overall charge efficiency than a charge rate of 25% of Ah capacity or 25A for a 100Ah flooded battery. Charge efficiency also changes with battery chemistry such as GEL, AGM or flooded and also changes as the batteries age.
Unfortunately the typical Ah counter cannot track nor can it calculate for any of these variables in charge efficiencies, it is not designed to do so. To further compound the issue many boats have multiple forms of charging, some with low rates such as solar and some with very high rates such as alternators.
With a Coulomb counter we simply need to set the charge efficiency the best we can. Some Ah counters can set CEF automatically and I strongly recommend using this feature but it relies on you getting back to 100% SOC regularly and can quickly get out of sync during PSOC cycling.
A charge efficiency factor is often set as 75%, 87%, 90% etc., if you choose to do it manually. This means a battery with a factory return ampere hour number of 110% gets set at 90%. Is this perfect? No, but it is the best we can do. All lead acid batteries require more ampere hours to be returned than were taken out.
Unfortunately Ah counters are not programmed to know the difference between BULK/constant-current and ABSORPTION/constant-voltage charging as related to the charge efficiency settings. The higher you go in the SOC range the less efficient the conversion of input energy to stored energy is. Charge efficiency is not simply 110%, 115%, 120% returned, at all stages of charging. The Ah counter only has one number to apply and that is the charge efficiency you set it to apply or that it has chosen to apply. This charge efficiency factor is applied regardless of where you are in the charge state, BULK or ABSORPTION, what the battery temp was, and regardless of rate of re-charge in current. It also ignores where you stopped charging in the SOC curve so PSOC cycling can throw a monkey wrench into the applied calculation.
Unless you do a full 100% recharge cycle, every time you discharge, the Coulombic efficiency setting will lead to counting errors when calculated to reflect SOC. If you partial state of charge cycle (PSOC) in BULK, when off cruising, these errors can add up quickly.
Testing for charge efficiency is considerably more complicated than Ah capacity so best to simply use the battery manufacturers stated charge efficiency factor or let the Ah counter calculate for you by discharging more than 10% of capacity and then doing a full 100% re-charge. The Xantrex Link monitors, the old Victron BMV-501 and a few others can “auto-calculate” the charge efficiency factor.
Many battery makers don’t publish a charge efficiency number so before buying batteries make sure you can get these numbers. Here’s a tip, don’t buy marine batteries from a company that can’t provide you a Peukert’s Constant, a general charge efficiency factor or the 20 hour Ah capacity figure.
Here’s an example of why a single number charge efficiency setting will lead to counting errors or drift in an Ah counter..
Begin Quote:
Lifeline Battery – “The amount of energy necessary for a complete recharge depends on the depth of discharge, rate of recharge, and temperature. Typically, between 102% and 110% of the discharged ampere-hours must be returned for full recharge.”
End Quote:
A single number for charge efficiency, such as 85% or 90%, is just not realistic in terms of overall accuracy on a vessel that PSOC cycles. However, that is what the battery monitor is set up for, and what we have to work with, so do your best to get it as close to accurate as you can. Finding this number may involve a call to your battery manufacturer or some deep internet searching. The Charge efficiency setting will cause out of sync events with an aging battery, & PSOC use, there’s just no way around this. Do the best you can to ascertain the best charge efficiency suggestion for your batteries. Again, if your Ah counter offers an automatic charge efficiency calculation, I suggest using it.
CAUTION: Not all battery monitors allow you to program for charge efficiency and they may try to internally apply a preset efficiency to all batteries. Be careful with monitors that leave this important programming option out or ones that do not offer an automatic CEF calculation.
I will leave charge efficiency with this quote from a US Government study of flooded lead acid batteries. In this test it was a Trojan G-31 flooded battery. Think about how an Ah counter would be calculating for CEF if you cycled your battery in the top 30% of the batteries capacity meaning 100% SOC to 70% SOC or say 60% to 90% SOC.
Begin Quote:
“Preliminary results agree well with established general understanding that the charge efficiency of flooded lead-antimony batteries declines with increasing state-of-charge, and that charge efficiency is a non-linear function of battery state-of-charge. These tests indicate that from zero SOC to 84% SOC the average overall battery charging efficiency is 91%, and that the incremental battery charging efficiency from 79% to 84% is only 55%.”
End Quote:
Think about that statement and how a single number charge efficiency could impact your bank if you shallow cycled it in the top 30% of the SOC range or routinely cycled in the most efficient range from 50% to 80%SOC. The charge efficiency algorithm in many Ah counters was designed with a 100% re-charge in mind not PSOC cycling as we do on boats.
Do the best you can with this one..
Peukert Compensation

This PC screen represents the Peukert’s Compensation for the Victron BMV-602. Here it’s set for 1.12 or the proper factory suggested setting for a Lifeline AGM battery.
I touched on the Peukert effect above, but there is more to it.
Most cruising boaters, with properly sized house banks, never draw their house banks in excess of the 20 hour rate, as an average load. Take for example a boat owner with a 450Ah battery bank. The 20 hour rate on this bank would be a load of 22.5A. So, at 75F – 80F with a 22.5A load this bank should deliver 450Ah’s, once broken in. Most boat owners with a 450Ah bank are drawing it down at well under 10A, on average. If you do not have an accurate Peukert’s constant programmed in you will be seeing an inaccurate SOC reading because it will not correctly calculate for Peukert.
WARNING: Most Ah counters only correct for Peukert when discharge loads exceed the 20 hour rate (high discharge corrections) and fail to calculate for discharge rates below the 20 hour rate (Low discharge corrections).
The sad reality is that most boats with Ah counters I set foot on have never had the Peukert setting on the Ah counter adjusted. The fault of the owner? No, not really because many Ah counter manuals suggest that leaving it at the factory setting should be okay…
IMPORTANT: Peukert computations are not a be-all-end all and tracking the Peukert Effect is very tough. For instance I have run tests on slightly used batteries where I will take a 100Ah battery testing at 97% of new and apply a 40A load for 1 hour (-40Ah). I then switch to the actual 20 hour rate of 5A and continue discharging down to 10.5V. I have yet to see a single battery I have tested match its factory predicted Peukert’s constant. Some on the net suggest that all the energy is still stored in the battery so a high load for a short duration won’t impact overall Ah capacity but it definitely does. Having an accurate Peuekrt’s Constant can help but it is not the panacea one might think it is.
Lead acid batteries used on boats range from a Peukert of about 1.11 to a high of 1.60. These are large variances in how your bank will discharge and how many ampere hours you can remove at XX rate of discharge can have a wide impact on battery SOC.
If a battery monitor does not have a way to program for the Peukert’s constant, and many don’t, the manufacturer should provide a good explanation as for how they compensate SOC for rate of discharge, either low side or high side, as related to the Peukert Effect. If the unit has no Peukert correction then the manufacturer should be able to explain how they compensate for varying discharge rates. I know Blue Sea is using some cool algorithms and it seems to work quite well. If an Ah counter manufacturer can’t explain this, walk away. Choose your battery monitor wisely.
Batteries, even when new, have widely varying Peukert’s constants and these too change with age. Having the correct factory Peukert’s constant programmed in can be important aspect in how these devices report & calculate for SOC as accurately as they can. Even if you do program it correctly, in regards to the Peukert’s constant, this too changes with age.
In the beginning, with new batteries, you might even see it lower than what the manufacturer says it is, but as the battery ages, it usually increases. A Peukert’s test can always be done but is often beyond the scope of most boat owners. A Peukert test involves two discharge tests, at varying discharge rates, and then a calculation to figure it out based on the differences. If you are willing to go to this length, Victron has a good Peukert Calculator on their web site.
In short, if your Peukert’s constant is not set correctly, as well as Ah capacity, and Coulombic efficiency you’ll really stand little chance at getting the accuracy you may desire from your Ah counter.
Peukert Effect on Capacity At Varying Loads
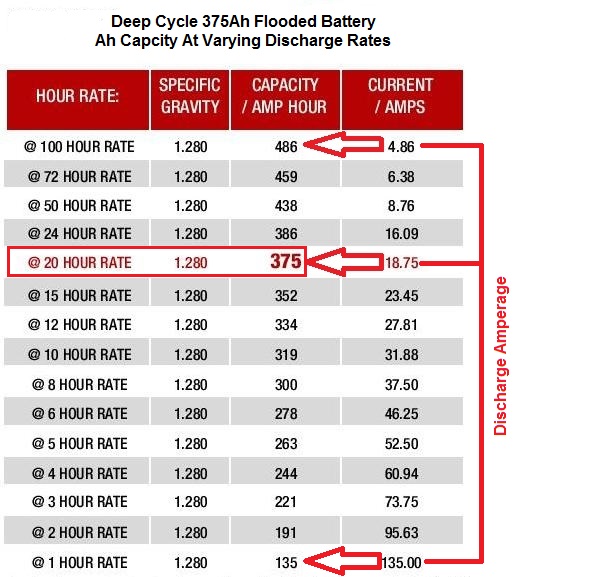
There is no better way to explain this than to show you an actual hourly capacity chart from a battery maker who publishes good reliable data. Don’t expect good data like this from Wal*Mart / Johnson Controls products or no-name batteries, it usually does not exist. This battery happens to be a very heavy duty L-16 deep cycle battery with a Peukert of 1.50.
So what can we glean from this chart?
100 Hour Discharge Rate – If we go all the way to the top we can see that if we apply a small load of 4.86A to this 375Ah battery it will run for 100 hours before hitting 10.5V and deliver 486 ampere hours of usable capacity! Yes 486Ah’s from a 375Ah battery when drawn at a low rate. This is the net positive side of the Peukert effect. By drawing this battery at 4.86A vs. 18.75A we’ve netted a usable capacity gain of almost 30%. If your battery monitor is not programmed to calculate for this, how accurate do you think your SOC will be….?
WARNING: Most Ah counters only compensate Peukert for HIGH DISCHARGE RATES. They completely leave out the low discharge side of the Peukert effect which can increase the banks usable capacity at a LOW DISCHARGE RATE. Most all Ah counters have no way to compensate for a 30, 40, 50 or 100 hour discharge rate.
Now look at the rate of discharge compared to our typical house-bank discharge rates on cruising boats. A good many cruising boaters discharge their bank at about 25-30% of the 20 hour rate? Well 4.86A is 26% of the 20 hour rate for this particular battery.
20 Hour Discharge Rate – This is a 375Ah rated battery and at an 18.75A load it will run for 20 hours and deliver its rated capacity. 375Ah ÷ 20 hours = 18.75A discharge rate. This is Peukert net neutral.
1 Hour Discharge Rate – Conversely if we apply a 135A load to this battery we can only get 1 hour of run time from it before it hits 10.5V. This is the net negative side of Peukert.
As can be seen from this battery manufacturers hourly discharge rate chart the Peukert effect is a setting that simply should not be ignored. Even if it only compensates one sided it still pays to program it as best you can. You really need to program your battery monitor for the correct Peukert in order to get the best information from it.
Let’s contrast that 1.50 Peukert L-16 flooded battery to a Lifeline AGM battery, which has a Peukert of 1.12. Using a 120 hour discharge rate, on the Lifeline AGM battery, will yield nearly 114% of its 20 hour rating (Lifeline does not publish a 100 hour rate). This is a large difference in the actual SOC of these two batteries especially if you can’t physically properly program the Peukert in your Ah counter for low discharge rates..
Peukert Effect Means:
-Loads above the 20 hour discharge rate = Less usable Ah capacity
-Loads at the 20 hour discharge rate = Rated battery Ah capacity
-*Loads below the 20 hour discharge rate = More usable Ah capacity
*Most Ah counting battery monitors do not account or correct for loads below the 20 hour discharge rate.
Battery Temperature
 This is another often overlooked, yet important, aspect of programming a battery monitor, if it even has this capability. This is one which both DIY’s and pro’s ignore with regularity, and neither installer really should unless the battery monitor does not allow for it and far too many don’t.
A 100Ah battery rated at 77F will not deliver 100Ah’s at 45F…..
“What? Huh? But it’s a 100Ah battery?”
Yes it is a 100Ah “rated” battery but only at 77F and when discharged at the 20 hour rate of 5A. At any other temperature or rate of discharge your usable capacity varies and this is what the Ah counter is trying to calculate for with the SOC screen. Here in Maine it’s not unusual for me to measure batteries in the early spring at 40-45F as the water temps are keeping the hull & battery compartment at close that temp. I then go into the owners battery monitor, such as a Xantrex Link-Pro, and see it programmed for a fixed temp range of 80F or 75F etc..
What do you suppose this does to the calculations & compensations the battery monitor is trying to apply in order to achieve the correct SOC for the battery? Do you think the Ah counter can be accurate with a 40F +/- difference between programmed temp and actual battery temp? The answer is no it can’t and this error is simply stacked on top of all the other programming steps that can all lead to counting errors. Frustrating and obvious as it may seem many Ah counter makers miss the mark entirely on battery temp and fail to give you an option to program for battery temperature nor do they offer an external temp sensor.
Ideally the best Ah counting battery monitor will be “full featured”and one that offers an on-battery temp sensor so these calculations can be done in real-time. The Xantrex Link-Pro & the Victron BMV-702 both offer this option as do Philippi Battery Monitors. Others may offer a programmable temp setting. If a monitor offers a programmed temp setting, (better than nothing) as opposed to an on-battery temp sensor, (ideal) the temp setting should realistically get periodically reprogrammed as water & battery temperatures change from season to season.
Different brands and chemistries of lead acid batteries will also perform differently under varying temperatures, but most battery monitors do not allow you to adjust the slope for temp corrections to SOC. The Victron BMV-702, with optional temp sensor, is the only one I know of that allows slope corrections for temp.
“Why would a temp slope option be important?”
Simply put a TPPL AGM (thin-plate pure-lead) will not be affected by temp changes exactly the same way as a deep cycle L-16 Rolls battery would. Bottom line, if your battery monitor offers a temp sensor, use it. If it offers temp slope corrections try to get this data from the battery manufacturer and use it.
Self Discharge:
While we are on the subject of the effects of temperature now is a good opportunity to discuss self discharge. As most boat owners well know, a lead acid battery will lose capacity just sitting there. While some Ah counters ask you for a % each month during set up, this self discharge, like everything else, varies with temperature. Suffice it to say that an Ah counter can’t really track self discharge very accurately. If your boat sits there for a week or two or three none of the self discharge will be accurately counted using a fixed percentage calculation. At 100F the battery could easily exceed the fixed % self discharge per month calculation and if at 40F the battery will come nowhere near the fixed % self discharge per month. Not a single battery monitor manufacturer has been able to confirm for me that self-discharge settings work with programmed or actual battery temp in the programming code.
Smarter Use of Your Battery Monitor
“But RC I have heard you say many times battery monitors generally lead folks to longer battery life, how can that be?”
That is correct and I still actually stand by that statement despite a lack of accurate programming. Let me share some reasons why I can say this…
Reason #1
Prior to having battery monitors many of my customers had simple analog volt meters. Most of these analog volt meters were quite inaccurate and many owners often discharged to well below 12.0V before recharging. They were in essence taking their battery to 70-80% DOD with each cycle.. Battery life for many was the typical 2-3 years we see with abused batteries.
Along comes the Ah counting battery monitor and all of a sudden the owner has a screen to watch, buttons to press and has some insight into the battery that never before existed. A good portion of these customers now started to be really careful about battery depth of discharge (DOD). The 50% DOD they assumed previously, which was really closer to 70 or 80% DOD, now became “Wow I am at 65% SOC I think I will recharge.” Human attention was brought to batteries that never had such a fan base.
Reason #2
Previous to the Ah counting battery monitor most owners had not a clue as to what their alternator or charging systems were doing. They watched voltage and when it got to 14.4V or so they stopped charging. With the battery monitor they could at least hold off until a good portion of the -Ah’s had been returned. Is this accurate? No, not at all, but it resulted in batteries getting to a higher SOC than the owners previously & regularly attained thus leading to overall healthier batteries.
Reason #3
Peukert rears his head once again. Remember when we talked about drawing the batteries at a slower rate of discharge and getting slightly more usable capacity from the bank due to the Peukert Effect? Keep in mind that many boat owners are discharging their banks at approximately 20-30% of the 20 hour discharge rate. A bank of 450 Ah’s can support a 22.5A load for 20 hours at 77F. If we draw that bank at 6A at 82F it will run longer than 20 hours at that load. This can make a typical deep cycle battery bank, as installed on cruising boats, appear slightly larger based on the low rate discharge. Many owners look only at the –Ah’s screen and then unknowingly mentally assume a Peukert of 1.00, which does not exist, even in LiFePO4 batteries. With this type of low current discharge use, the actual DOD before recharge was slightly higher than was assumed by looking only at the -Ah’s screen & thus a shallower DOD before recharge and a higher SOC after recharge.
With those three points it is easy to see how we take an average battery life of 2-3 years and extend it to 4-5 or more, even with a poorly programmed monitor. There of course does eventually come a point where the battery monitor is actually harming the batteries when actual capacity fade has not been accounted for and these batteries tend to litreally fall off the proverbial cliff, when this occurs.
We can do better, if we program more accurately.
“ RC I want to keep my Ah counter more accurate, keep it on its toes so to speak, but I am just not inclined to do an actual 20 hour capacity test? What else can I do?”
The *Old School SOC Test:
- Check the SOC screen and write it down
- Check the –Ah’s screen and write it down (Hint: -Ah’s and SOC should almost never agree)
- On a day when the batteries are between 75 & 80F disconnect them
- Allow them to sit for at least 24 hours (AGM & GEL may take longer)
- Test the specific gravity (SG) or the open circuit voltage (OCV) at the battery terminals
- Compare this voltage or SG reading to your manufacturers; SG to SOC or OCV to SOC scales. (Avoid batteries that don’t have this data)
- How does this compare to your Ah counter?
*A marginal method for checking for the level of honesty in your battery monitor at tracking SOC
It’s important to understand that every 10% of battery capacity is represented by an approx 0.1V change in the rested open circuit voltage (OCV) reading. A short rest or an incorrect OCV reading is no better than an improperly calibrated battery monitor at finding your approximate SOC.
Different batteries from different manufacturers will have a slightly different rested OCV or SG for determining the approximate SOC. Generic scales for this, often found on the internet, may not apply well to your particular batteries. Always get your OCV to SOC or SG to SOC charts directly from the manufacturer of your batteries.
Please also understand also that the test above only tells you how the monitor is tracking against SOC, not what your current Ah capacity is. Specific gravity (SG) or OCV readings tell you nothing about the actual Ah capacity your battery can deliver. For determining Ah capacity the only thing you can do is run a physical 20 hour Ah capacity test.
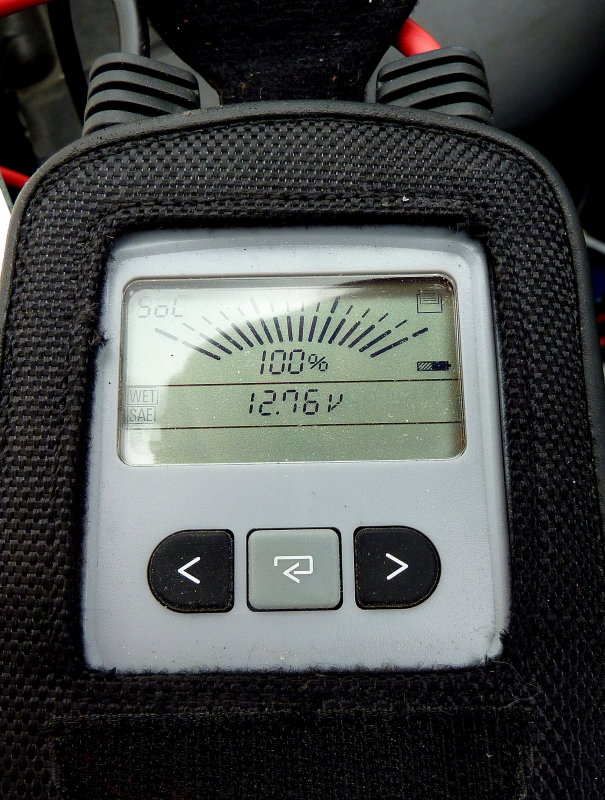
The battery bank represented by the meter reading, shown at 12.76V, had rested for approx 3.5 hours completely disconnected, at 80F. After 24 hours it was giving an OCV reading of 12.54V, or approx 84% SOC for this battery bank. The Ah counter said the battery was 100% full, a 16% difference in the relative SOC readings. If we had accepted the 3.5 hour OCV reading we would have incorrectly assumed the Ah counter was accurate when it was really 16% off.
“But RC 16% is not that much is it?”
This was a 450Ah rated bank so a 16% counting error = a 72 Ah variance. A 72Ah mistake is an entire day’s energy use for this particular boat. To compound on that counting error, when these batteries were tested they were really only 383Ah’s…. This is how the snowball rolls…
Avoid Using Auto-Sync or Auto-Reset
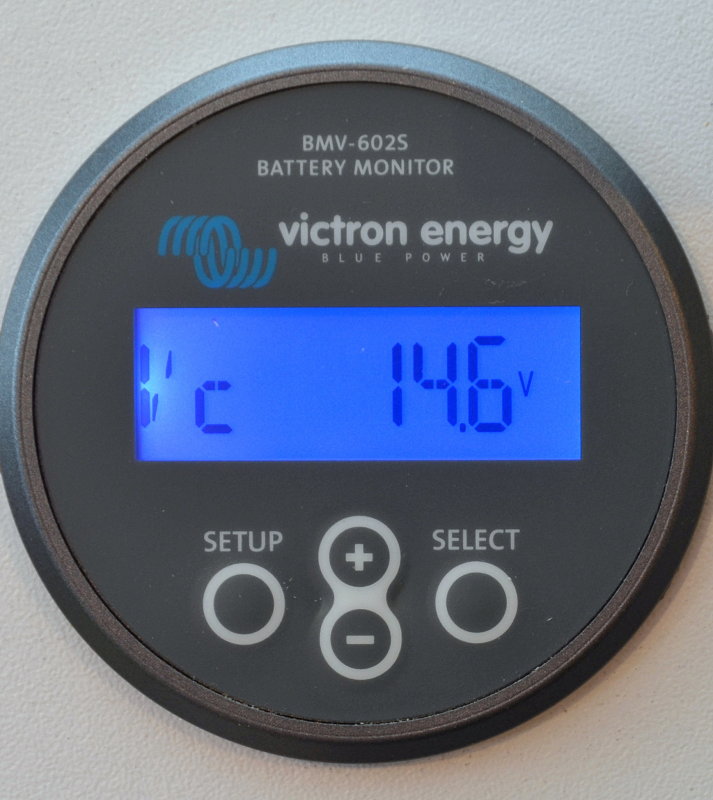
Most all Ah counters attempt to re-set to 100% at the same point in time your batteries reach full. In theory this sounds great. In practice, in the real world, this is very often an utter failure. In regards to auto-sync most Ah counter owners will be far better served to simply program this out or turn this off if it allows. The problems surrounding Ah counters and auto-sync are so problematic the issue has even earned itself a nickname, “The Gotcha“…..
To program auto-sync out/off simply plug in parameters that are not possible for the charging system to meet. In this image I have programmed the Vc or “Voltage Charged” to 14.6V. Considering this is for a GEL battery, which never ever charges above 14.1V, the battery monitor can not “auto-sync” at the wrong time because Charged Voltage will never get to 14.6V. Simple stuff…
Unless you have one single charge source, and you tie to a dock after every use of your boat, or even RV, and leave it there charging for more than 24 hours, you would be wise to not use auto-sync. For boats with multiple charge sources, especially solar & wind, you can spend lots and lots of time trying to get this programming right and still fail to do so.
“RC, Isn’t my battery full when the ampere hours on the screen are returned to zero?”
Contrary to popular misconception Ah counting battery monitors do not always reset based on Ah’s returned to the battery. Instead they use a number of factors such as; voltage, time, current and time at both current and voltage to try and determine when the battery is actually full. Unfortunately, with multiple charge sources, and house loads, they can get confused and tricked into prematurely re-setting to 100% SOC..
These are the parameters the most widely used Ah counters use to determine “full”.
Charged Voltage:
This is the voltage the battery monitor looks for in order to qualify for a “full charge” reset. Voltage above XX.XX volts = CHECK
Tail Current:
Tail Current is the amount of charge current the charge source needs to be below in order to qualify for a “full charge” auto-sync reset. Current below X.XX amps = CHECK
Charged Detection Time:
The monitor looks at Charged Voltage and Tail Current and applies a min Time Factor at those levels. If the time for voltage and amperage meet the minimum time applied factor this = Auto-Sync Reset to 100% SOC
Minimum Discharge % Threshold:
Some Ah counters need to see a 10% discharge, from full, before allowing an auto-sync based on the above factors. This means that you’d need to dip to 89% SOC for an auto-sync could occur.
The “Gotcha” Conundrum:
Now let’s look at this in a real world scenario. Your boat has a solar array and it’s early to mid morning. The batteries are still in bulk charge mode, and the solar system is just barely able to get them to your Charged Voltage setting of 13.2V.
Because of the low current supplied by the solar array, due to it being early in the day, all the PV system can muster is 13.2V, and at a current below your Tail Current. If you’ve dipped below 90% SOC over night & the system proceeds like this for longer than the Charged Detection Time, regardless of where you are in the SOC range, the monitor can actually reset itself to 100% SOC.
I have been sitting next to batteries 30-40Ah’s known discharged when a battery monitor has reset to 100% SOC. I glance over one minute and it is at 85% SOC and the next it has reset to 100% SOC. This is simply poor programming and leads to vicious counting errors.
System loads on your boat, such as water makers, refrigeration etc. can also pull charging voltage and net charge current below the charged detection parameters, if your charge source is not able to muster it all. These house loads can also indirectly cause the monitor to reset on voltage, tail current and charged detection time.
There are many scenarios we can paint that can cause some of these monitors to reset falsely & prematurely thus creating more counting errors.
For the average boater, simply turn off or program out auto-sync…
For the die hard electrically minded individuals out there it is possible to program auto-sync to still work, but this is a recipe you’ll need to figure out for your own system and your system only. There are far too many variables to give a cookie-cutter recipe for auto-sync especially when we start mixing in solar or wind etc..
I set foot on far too many boats with battery monitors reading 100% SOC where I fire up the motor and the alternator is pumping 20-40A plus into the batteries. These are not 100% SOC batteries… A full & healthy battery will accept less than 1% of its Ah rating at absorption voltage. A Manual Sync current of 1.5% – 2%, of Ah capacity, is a safe number for a cruising reset target.
Disable the “auto-sync” feature and use manual “known-full” re-sets.
“Come on RC, what the heck is a known-full reset?”
The Known Full Reset:
#1 Turn all DC loads OFF
#2 Fire up battery charger or engine & allow to run 4-5 minutes
#3 Voltage should be at ABSORPTION level or 14.4V+ (GEL 14.1V)
#4 Net accepted charge current should be less than 1.5% -2% of Ah capacity
#5 Okay to MANUALLY reset to 100% SOC
IMPORTANT:
Battery voltage should be at absorption voltage not float voltage, unless it has been floating in excess of 24 hours.
A known-full reset takes but a few seconds once the charge source has run for a few minutes. Easy and known accurate.
You can use 2% as your known-full current threshold but 1% or 1.5% is a fuller and healthier battery. For example most AGM batteries are not even considered full until they hit 0.5% of their capacity in net charge current at absorption voltage.
For a 1% reset with non-GEL lead acid batteries:
100Ah Battery – Voltage ≥ 14.4V and Charge Current ≤ 1.0A
200Ah Battery – Voltage ≥ 14.4V and Charge Current ≤ 2.0A
300Ah Battery – Voltage ≥ 14.4V and Charge Current ≤ 3.0A
400Ah Battery – Voltage ≥ 14.4V and Charge Current ≤ 4.0A
500Ah Battery – Voltage ≥ 14.4V and Charge Current ≤5.0A
Etc. etc.
By using a known-full manual re-set you are not guessing when your battery is full, you know when they are full. Resetting your Ah counter to known-full regularly, especially after a few PSOC cycles, helps keep it in better synchronization with your bank for SOC predictions.
How Did I Arrive At All This?
I know it is a lot to absorb and to comprehend. Much of it I know will go directly against what you thought you knew about Ah counters, and I’ apologize for that.
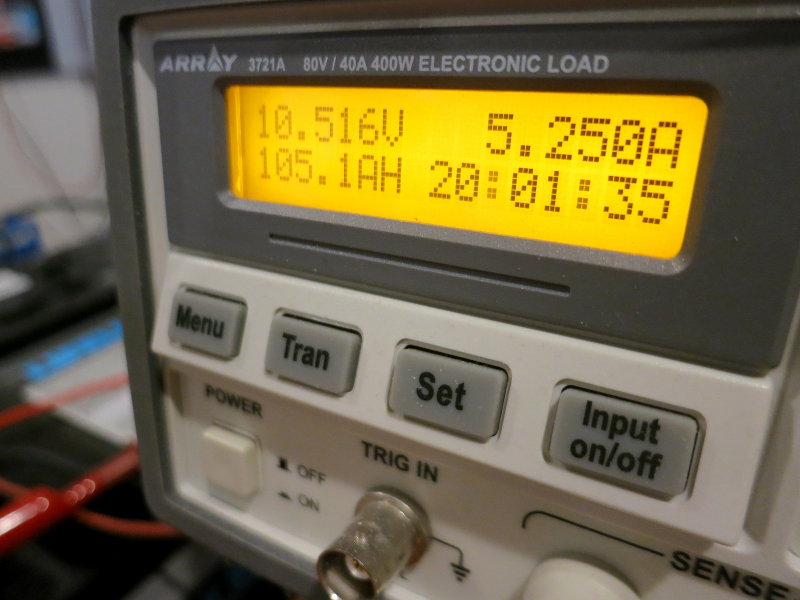
How did I arrive at all this? It’s what I do and part of my job to understand this stuff. I actually test an awful lot of batteries for 20 hour capacity. All my tested batteries are run through the paces in a controlled temp “water bath” set for 77F (unless testing certain GEL batteries) and tested with laboratory grade calibrated test equipment. The battery being tested in this image is at the very tail end of a 20 hour capacity test. It is a Lifeline GPL-31T rated at 105Ah’s. As can easily be seen it delivered slightly over 105Ah’s and the 5.25A load is just about to cut off at 10.499V..
With this information an Ah counter can be more accurately programmed. Without accurate programming you can use your Ah counter but just don’t expect more than a general ball-park accuracy. Is this bad? Heck no, but I think you’ll agree we can always do better.
Don’t fret it though, there are many ways to look at this:
#1 You now have a better understanding of Ah counters and will be more careful trusting yours empirically, as you may have in the past.
#2 You are perfectly happy with your banks performance already so if you can tweak it just a bit, and get better life, you’ll be in 7th heaven.
#3 You’re a a geek at heart and you want this damn thing to be as accurate as you paid for…. Good luck.. (wink)
Let’s Keep This Site Running!
Like what you saw or read? Would you like to see more articles like this? Is so feel free to donate, support the site and keep it growing. I am trying my hardest to keep this information FREE. If you liked it, learned from it or I saved you some money feel free to make a small donation, that’s all I ask.