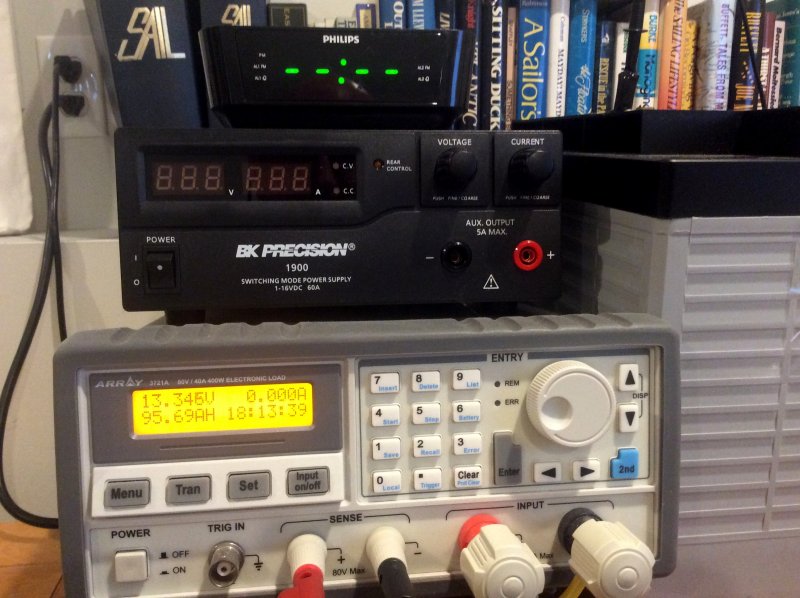
After 20 Hour Capacity Test = 95.69 Ah Capacity
For this test I wanted to:
- Show the relationship of loaded voltage to SoC on a popular AGM lead acid battery.
- Utilize a battery not in perfect health to represent real world.
- Show why using a generic voltage to SoC chart may not work for your battery bank.
Show the actual rebound voltage after discharging to 50% SoC under controlled conditions.
MHT Recommended Test Equipment& Monitors
We are asked all the time about the test equipment we use here and also the battery monitors we recommend.
Buy MHT Recommended Test Equipment
Buy MHT Recommended Battery Monitors
Customers SoC to Resting Voltage Chart
This image is an epic fail on our customers part, despite his very good intentions.
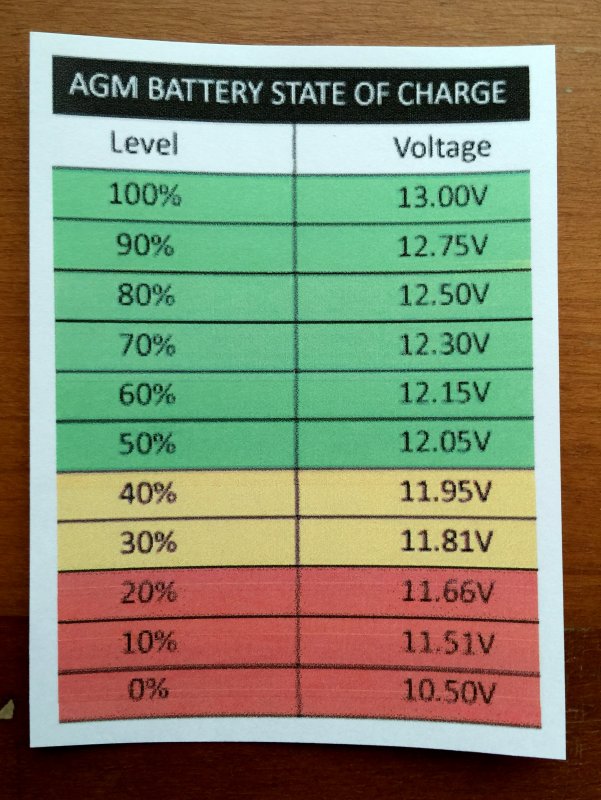
He located this voltage to SoC chart on the internet and I discovered it on his chart table. He was using it with resting voltages not under-load voltages as this chart was likely developed from. His battery bank was comprised of the identical battery being tested here.
If we cross reference this chart to the 20 hour discharge rate, under-load voltages, in this test they line up pretty closely but if using a chart like this for a RESTING VOLTAGE you will essentially be murdering your batteries.
Chart Resting Voltage Actual Under-Load Voltage
90% 12.75V 12.55V
80% 12.50V 12.50V
70% 12.30V 12.37V
60% 12.15V 12.24V
50% 12.05V 12.11V
Please be aware that some charts on the internet are for resting voltages. A resting voltage is 12 – 24+ hours of no loads or charging at 77°F. The “at 77°F” is absolutely critical because at temps above 77°F surface charge dissipates more rapidly and at temps below 77°F the surface charge dissipates more slowly.
As I type this I have a fully charged AGM battery in my storage barn that has been sitting 100% disconnected for well over a month, and the resting voltage is still 13.12V. Why? The battery temp is close to 40°F right now and has not been much above 45°F since I set the battery in storage. I know this battery will rest at 12.93V once the surface charge has dissipated, but at 40-45°F this can take weeks or as long as a month or more.
Voltage to SoC Charts:
A Voltage to SoC chart should only come directly from the manufacturer of your batteries, or through physical testing of your own batteries, as I have done here. You should avoid the use of use generic charts off the internet. Why? Because every battery manufacturer will have a slightly different voltage performance curve under load. Deep Cycle AGM will be slightly different than dual purpose AGM or TPPL AGM or GEL or flooded etc..
Some charts you find on the internet do represent a “resting voltage” , but you’ll also find some for a 20 hour discharge rate or an under-load voltage. If you’re using voltage as an indicator of SoC, the rate of discharge, as well as battery temperature, can also affect your SoC to voltage points. Cyclic On/Off loads, like we have on a boat, can also tweak this relationship. Using the wrong Voltage to SoC chart only exacerbates issues related to using voltage for SoC estimation. Using the wrong chart can actually accelerate the murdering of your batteries.
Voltmeters:
On top of using an incorrect Voltage to SoC chart, using an inaccurate voltmeter or one connected or voltage sensed in the wrong location can also impact you negatively. Always use a good quality, known accurate voltmeter that can display out to the hundredths position, not just the tenths position. For example, a voltmeter that only reads 12.1 volts gives too little information. A voltmeter that can read 12.15V, or adds the hundredths of a volt position, will give you far better trend information. The voltmeter should have both it’s negative lead and positive lead directly sensing/measuring the house banks physical battery terminals, or within a few inches of the bank on a distribution bus fed by large gauge wire. Sensing voltage anywhere else in the system can lead to erroneous voltage readings due to circuit voltage drops.
Site Plug:
PLEASE HELP!
This site is 100% reader supported. My wife is urging me to shut it down as it just keeps costing us money. My stroke recovery is very costly as is authoring this website and keeping it secure.
Click the DONATE button below if you would like to make a donation via BUY ME A COFFEE.

95% SoC – 5.25A Load – Volts =12.59V
The battery used in this test is a very popular AGM, a Lifeline GPL-31T.
It is factory rated at 105Ah, at the 20 hour discharge rate, but this particular battery, off my brothers boat, was used and only capable of delivering 95.69 Ah’s. I chose this slightly used battery to represent a more “real world” scenario. A 20 hour discharge rate is simply:
Ah Capacity ÷ 20 = X
For this 105Ah rated battery the 20 hour discharge rate looks like this:
105Ah ÷ 20 = 5.25A
Despite the slightly diminished capacity, 91.3% of the factory rating, I chose to keep the discharge rate at 5.25A at a controlled battery temp of about 76.4°F. Ideally I would have liked to have spent the time to figure out the new 20 hour discharge rate but this entails numerous tests to 10.5V and was not critically necessary for this experiment, as no boat owner will ever do this.
The 5.25A discharge rate is slightly higher than what this battery can actually deliver for 20 hours, but close enough to make the points I wanted to share here. Perhaps less than .02% of boat owners ever test their batteries for actual Ah capacity, so using the 20 hour rate on this battery is still quite realistic.
For a 20 hour test, or to see where your bank stands against how it is rated for Ah capacity, a 20 hour SoH (state of health) discharge test is performed. To perform a 20 hour test the battery is first charged to 100% SoC and then it’s allowed to rest for 24 hours. It is then discharged at a constant 0.05C discharge rate or Ah ÷ 20= X to a terminal voltage of *10.5V. The Ah’s or time at discharge rate is then calculated to show the percentage of the rated Ah capacity the battery could deliver at its current SoH. A discharge rate of 0.05C is equal to 5% of the batteries 20 hour rated capacity so 5% of 105Ah is 5.25A.
*Assumes a 12V battery. During a 20 hour Ah capacity test the battery is discharged to 1.75V per cell.
On a cruising boat the battery bank would be considerably larger and a 20 hour discharge rate, at bank level, would look like this:
- 200 Ah Bank = 10A Discharge Rate @ 77°F
- 300 Ah Bank = 15A Discharge Rate @ 77°F
- 400 Ah Bank = 20A Discharge Rate @ 77°F
- 500 Ah Bank = 25A Discharge Rate @ 77°F
- 600 Ah Bank = 30A Discharge Rate @ 77°F
90% SoC – 5.25A Load – Volts =12.55V
In this image the battery is at about 90% SoC with an under-load voltage of 12.55V.

On a 400Ah bank this would be a 20A load in order to see this voltage at 90% SoC. If you were discharging at 8A and saw 12.55V you would be at a lower SoC than 90%.
85% SoC – 5.25A Load – Volts =12.52V
Here we are crossing the 85% SoC mark at 12.52V. As cruising boaters the average discharge rate is almost always far lower than the 20 hour rate, and should be lower.
A typical cruising boat with a 400Ah bank will be discharging, on average, somewhere in the 5-6A range if averaged over a 24 hour period. Your under-load voltages should not drop this fast with healthy batteries. Conversely your SoC to loaded voltage will also not be the same as here. At the voltages to SOC show here, your SoC will actually be lower when discharging at a lower discharge rate. The reason for this is due to the Peukert Effect or what some call Peukert’s Law.
80% SoC – 5.25A Load – Volts =12.47V
Here the battery at about 80% SoC under the same continuous 5.25A load, and we are at 12.47V.
Voltage can be used as a guide for SoC but you really need to know the voltage performance of your battery bank, against a known discharge rate, and it takes work to figure this out. Of course once you’ve figured it out, the voltage behavior under-load will change on you as the batteries age.
There is also another gotcha in the mix that I should mention. Loads that cycle on and off give the battery rest periods which also change and modify voltage performance at XX load. If your loads cycle on and off, and you choose to use voltage for SoC, you may be over-discharging your bank and never even know it.
This is why a generic *OCV to SoC chart will rarely help the average boater, and often serve to actually help prematurely damage the batteries.
*OCV = Open Circuit Voltage Reading
75% SoC – 5.25A Load – Volts =12.42V
Over the years I have realized that most boat owners drastically over discharge their battery banks when using voltage as a predictor.

In a recent battery use survey on SailboatOwners.com there were over 1000 responses, of which 98.4% were from sailboat owners. The survey was about marine battery use. Of those 1000+ responses, 1188 to be exact, 72.42% of respondents regularly discharged the bank below 12.1V. As Homer would say…. D’oh!!!!!
What’s bottom line with lead acid batteries?
Even at your average house loads the terminal voltage should not be dipping below 12.1V, when discharging at the 20 hour discharge rate.. That is if you expect any sort of decent cycle life from them. As you will see in this experiment, under a 5% load to Ah capacity discharge, 49.3% SoC is achieved, under load, at 12.10V. Most boaters however don’t discharge at the 20 hour rate, so read on.
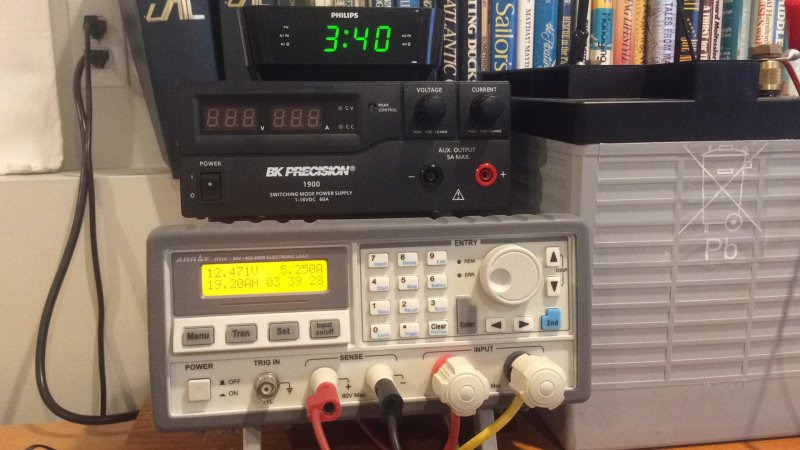
70% SoC – 5.25A Load – Volts =12.37V
Here we are at 70% SoC and 12.37V.

Compare this to the chart from above at 12.30V that our customer was using as a resting voltage chart. This is not a resting voltage, it is an under-load voltage, and the battery has been under a constant 5.25A load now for nearly five and a half hours straight. If you were expecting a 12.30v resting voltage to represent 70% SoC, you are now way below 70% SoC…. Oops…..
65% SoC – 5.25A Load – Volts =12.30V
65% SoC under-load voltage = 12.30V.

60% SoC – 5.25A Load – Volts =12.24V
60% SoC under-load voltage = 12.24V…

55% SoC – 5.25A Load – Volts =12.18V
55% SoC under-load voltage = 12.18V…

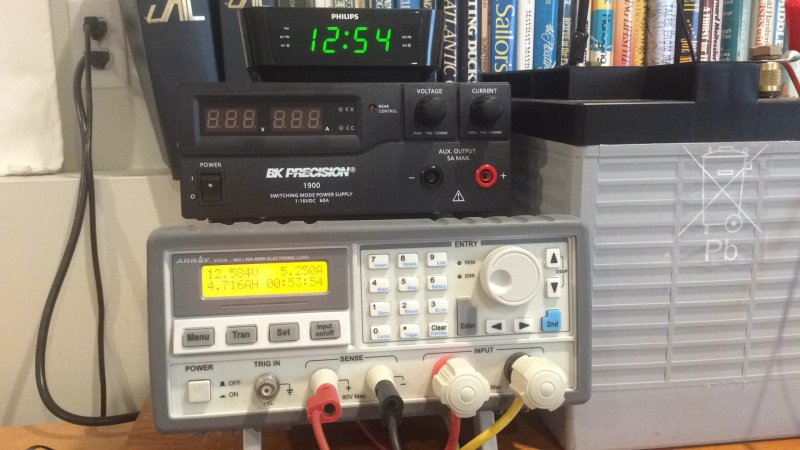
50% SoC – 5.25A Load – Volts =12.11V
Here we are at 50% SoC, based on the -Ah removed from a baseline, under a capacity test.
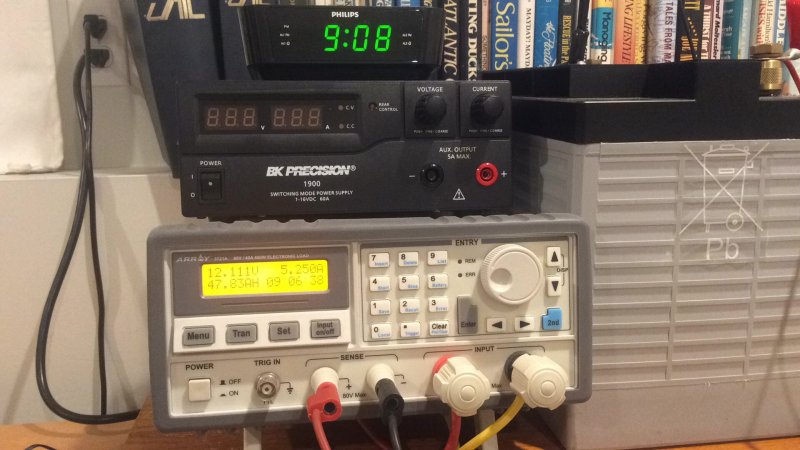
It took approximately 9 hours at a 5.25A load to get to 50% SoC and the under -load voltage is still 12.11V. To put this in perspective, when this battery was discharged at 2X – 2.5X your average cruising boat house loads, the bank is crossing the 50% SoC threshold at approx 12.1V. This means on your average bank you had better be discontinuing any discharging at somewhere around 12.15V to 12.2V+.
If you expect or plan to use voltage as your indicator of SoC, and as an indicator of when to re-charge, I would strongly urge you to begin recharging at a maximum under-load voltage of 12.1V. You will be far better served to begin recharging at 12.2V or greater because your average discharge rate will be lower and you will also have cyclic loading of the battery which can artificially inflate a Voltage to SoC reading.
If your average house loads are a lower average load than the 20 hour discharge rate, you will be better served to begin re-charging at a low of 12.15V – 12.2V+, in order to get the best cycle life from your bank.
49.3% SoC – 5.25A Load – Volts =12.10V
Here’s why I suggest you begin recharging at 12.15 -12.2V because at 12.1V this battery is already at 49.3% SoC while being discharged at 5.25A at 76F.

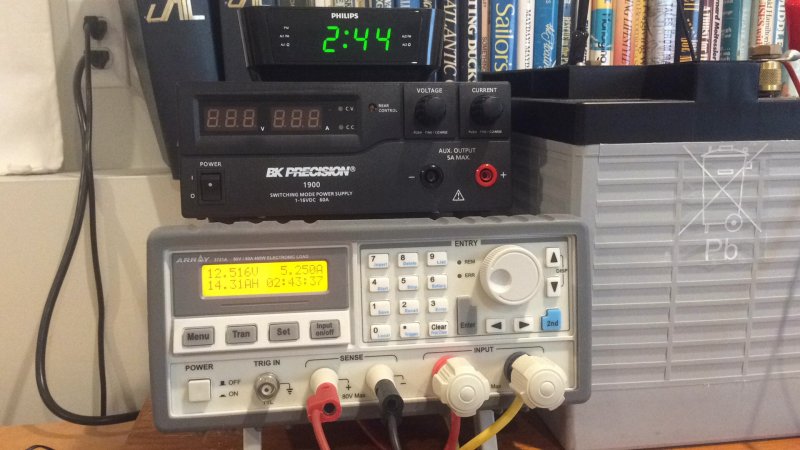
Resting Voltage -16 Hours @ 49.3% SoC, 76°F = 12.32V
In this image the battery is at 49.3% SoC based on removed ampere hours.
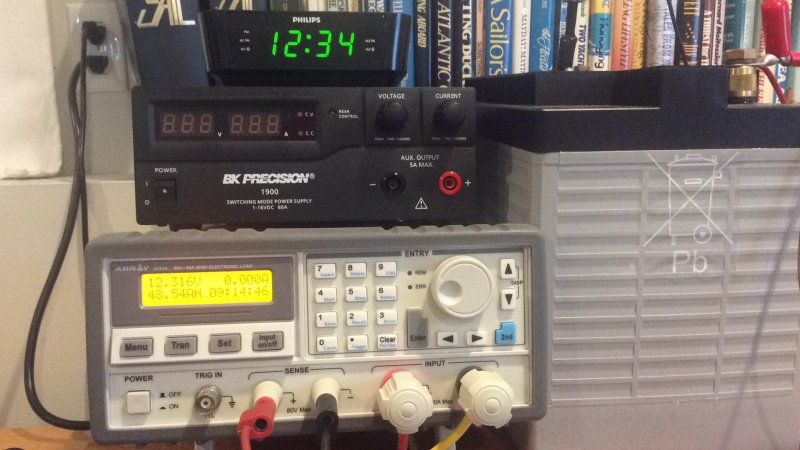
The resting open circuit voltage has rebounded to 12.32V. If you had been using our customers chart for resting OCV you would have mistaken 49% SoC for 70% SoC and kept on DISCHARGING the bank. Ouch!
With this test it’s easy to see how battery assassins commit battery murder without even being aware of it. Please understand and use voltage for SoC very carefully. Also, keep in mind that as your batteries age they will cross a voltage threshold differently than they did when new. The only way to know this performance is to physically test for it.
For most boat owners we strongly recommend using a good battery monitor The Victron BMV series or smart shunts are excellent are excellent.
Buy MHT Recommended Battery Monitors
Points to Ponder:
- Always get your Voltage to SoC data directly from the physical manufacturer of your batteries, not from the net.
- Make sure you know what your voltage to SoC chart represents; eg: “resting voltage” or “under-load voltage”. They both exist and are not the same.
- Study and learn your batteries voltage behavior, under your average on-board loads. Run experiments if you need to.
- Use a known accurate voltmeter that displays to the hundredths position.
- Your voltmeter should only sense voltage at the battery bank terminals.
- Discharge rate affects your Voltage to SoC relationship.
- Cycling discharging affects your Voltage to SoC relationship.
- Battery temperature affects your Voltage to SoC relationship.
- Aged batteries affect your Voltage to SoC relationship
- As your batteries age the voltage behavior will also change.
- Battery temperature directly impacts the time it takes to attain an accurate resting voltage.
- Keep it simple, don’t discharge your Lifeline AGM bank below 12.15V to 12.20V even under your average house loads.
- Recharge your batteries to 100% SoC as soon as possible after each discharge.
Good luck & happy boating!
PLEASE HELP!
This site is 100% reader supported. My wife is urging me to shut it down as it just keeps costing us money. My stroke recovery is very costly as is authoring this website and keeping it secure.
Click the DONATE button below if you would like to make a donation via BUY ME A COFFEE.
You are totally right about it. I did my own test once I read this. I found the same thing on my study. I have a small 24V solar battery bank with two 105 Ah batteries in series. In addition to this, I have a samplex battery guard set up to work between 24V – 26V. Once the voltage under load reaches 24V , the battery guard kills the power to the inverter having the battery bank reaching aprox 50% of SOC. This works find but what does not work find knowing what I know now, is that the battery bank never reaches not even 70% SOC before it reaches 26V again while solar charging. I have been running my system between 50% – 70% SOC all the time without knowing it.
During my study, I stopped charging the batteries once the battery guard killed the power to the inverter reaching 24V under constant load. The load was 3.0 Amps. After 30 mins of rest, I then watched the voltage bumping back again to 24.9V. According to the table, at 24.9V the SOC is supposed to be 80%. I then used a hydrometer to check the electrolyte to find out it was between 1.15 and 1.21; which means the battery is not at 80% state of charge and it needs to be recharged before more power is drawn from it; otherwise, the battery can reached SOC lower than 50%, thus reducing the lifespan of it.
Thank you for providing this useful information. Since this study, I have changed the way I charge and discharge my batteries to extend the life of them.